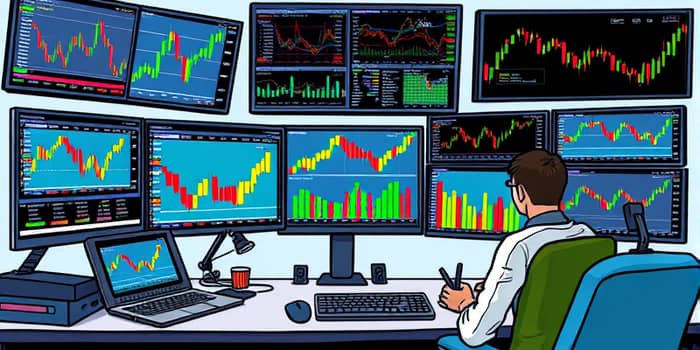
Technical indicators are more than just lines and bars on a chart—they are powerful tools that reveal hidden patterns in market data. When chosen and applied thoughtfully, they can illuminate trends, momentum, volume shifts, and volatility, guiding traders toward informed decisions.
In this comprehensive guide, we will explore the core principles of technical analysis, examine the main categories of indicators, highlight beginner-friendly tools, discuss time frames, reveal effective combinations, share best practices, and explain how to apply these techniques across diverse markets. By the end, you will have a clear roadmap for transforming raw market data into actionable insights.
Core Principles of Technical Analysis
At its heart, technical analysis relies on three foundational beliefs:
1. The market discounts everything: All known information—economic data, news, and sentiment—is already reflected in price.
2. Prices exhibit trends: Markets move in trends, whether upward, downward, or sideways, over any time frame.
3. History tends to repeat itself: Predictable market psychology leads to recurring patterns driven by fear and greed.
Technical indicators take raw price and volume data and convert them into visual signals, helping traders separate meaningful market moves from random noise. By trusting historical price action, analysts can anticipate future movements more reliably than by estimating intrinsic value alone.
Overview of Main Indicator Categories
Technical indicators fall into four primary categories, each serving a distinct purpose:
Understanding these categories allows traders to select tools that complement each other, offering a multi-dimensional view of the market.
Key Indicators for Beginners
For those new to technical analysis, these five indicators provide an excellent starting point:
- Moving Averages (Simple and Exponential): Smooth out price data to identify trends and potential support or resistance levels.
- Relative Strength Index (RSI): A momentum oscillator measuring speed and change of price movements; values above 70 suggest overbought, below 30 oversold.
- Moving Average Convergence Divergence (MACD): Combines trend-following and momentum characteristics by tracking the relationship between two EMAs.
- Bollinger Bands: Consist of a middle SMA and upper/lower bands that expand and contract based on volatility.
- On-Balance Volume (OBV): Confirms price moves by accumulating buying and selling pressure.
Each of these tools is intuitive to apply and interpret, making them ideal for building a solid technical foundation.
Time Frame Selection
Choosing the right time frame is critical. Different traders have different horizons and objectives:
Intraday charts (1-, 5-, 15-minute) suit day traders who open and close positions within a single session. These charts highlight short-term fluctuations but can be noisy.
Hourly and 4-hour charts cater to swing traders looking for moves over several days. They balance signal clarity with timely action.
Daily, weekly, and monthly charts serve long-term investors. These higher-timeframes filter out short-term noise, revealing major trends and cycles.
Your chosen time frame should align with your trading style, risk tolerance, and availability to monitor markets.
Combining Indicators for Maximum Impact
No single indicator is foolproof. Seasoned traders blend complementary tools to filter false signals and build confidence:
MACD + RSI: Use MACD to confirm a trend and RSI to avoid entering overbought or oversold conditions.
Moving Averages + Volume Indicators: A price breakout above a moving average gains validity when accompanied by rising OBV or volume spikes.
RSI + Bollinger Bands: Look for RSI extremes near upper or lower Bollinger Bands to spot potential reversals in volatile markets.
By combining indicators from different categories, you create a layered decision-making framework that reduces risk and enhances precision.
Best Practices for Traders
To use technical indicators effectively, follow these guidelines:
- Avoid indicator overload: Too many tools can create conflicting signals and decision paralysis.
- Use complementary indicators from different categories: Trend, momentum, volume, volatility.
- Test indicators on historical data: Test indicators on historical data to validate strategies before risking real capital.
- Consider multiple time frames: Confirm signals on a higher-timeframe chart to strengthen trades.
- Integrate technical analysis with other methods: Many fundamental investors use indicators for precise timing.
Applying Technical Analysis Across Markets
Technical analysis is versatile and can be applied to a wide range of markets:
- Stocks: Identify entry points for individual equities or sector ETFs.
- Forex: Capture currency pair trends and volatility shifts.
- Cryptocurrencies: Navigate highly volatile digital assets using momentum and volatility indicators.
- Commodities and Futures: Time trades on oil, gold, agricultural products, and more.
Regardless of the market, the principles remain consistent: focus on price action, volume, and psychological patterns.
Education and Continuous Improvement
Mastering technical analysis is an ongoing journey. To deepen your expertise:
Obtain certifications like the Chartered Market Technician designation to demonstrate proficiency. Enroll in online courses and participate in webinars offered by reputable platforms.
Practice with demo accounts to hone your skills without financial risk. Analyze historical charts and journal your trades to identify strengths and weaknesses.
Join trading communities to exchange ideas, discuss strategies, and stay informed about evolving market dynamics.
Conclusion
Technical indicators are indispensable tools for any trader seeking an edge. By grasping the core principles of technical analysis, selecting the right indicators, mastering time-frame alignment, and practicing disciplined combinations, you can transform market data into clear, actionable signals.
Remember that success comes from continuous learning and adaptation. Embrace backtesting, refine your approach based on results, and stay open to new insights. With patience and persistence, you will harness the full power of technical indicators to navigate markets with confidence and control.
Start your journey today by applying these concepts to a demo account. Watch as small disciplined steps build into sustainable trading success.
References
- https://www.investopedia.com/top-7-technical-analysis-tools-4773275
- https://www.fidelity.com/learning-center/trading-investing/technical-analysis/technical-indicator-guide/overview
- https://corporatefinanceinstitute.com/resources/career-map/sell-side/capital-markets/technical-analysis/
- https://www.incrediblecharts.com/indicators/technical-indicators.php
- https://www.luxalgo.com/blog/a-beginners-guide-to-technical-indicators/
- https://www.altrady.com/crypto-trading/technical-analysis/types-of-technical-indicators
- https://www.investopedia.com/terms/t/technicalanalysis.asp
- https://synapsetrading.com/trading-guides/technical-trading-indicators/